When we splurge on ourselves, some of us like to go to the spa, others like to treat ourselves to a nice meal, and some don’t splurge at all. Although spending patterns change over time, in the last few months of the pandemic some noticeable trends have emerged, according to national CivicScience data (a data partner of Q.Digital).
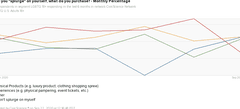
Take note of this graph highlighting LGBTQ Adults 18+:
LGBTQ consumer spending on experiences vs. physical products has shifted over the past several months. In April, for example, 21% of LGBTQ consumers said they splurge on physical products vs. 27% who splurge on experiences. In other months, the gap was even wider.
Intuitively, this makes sense given that most of us have been stuck in our homes for months, craving a change of scenery, whether it be a safe trip or tickets to a long-awaited show that has moved outdoors. Consumers have never craved experiences more, and this is particularly true of LGBTQ consumers who over-index in travel and social experiences compared to their non-LGBTQ counterparts.
Although this pent-up desire for experiences will remain as the pandemic lingers, it looks like consumer desire for physical products is heading in a positive direction. As of August, 25% of LGBTQ consumers say they prefer to splurge on experiences, whereas 23% prefer products. This month, that gap seems to be closing even more.
The fact that physical products have now caught up to experiences makes complete sense given that our in-home lives are now so central to our health and wellbeing. Though we crave new experiences, we also crave ways to pamper ourselves while at home and with limited access to travel and interaction with others.
Mirroring this trend, take a look at this:
Since August 1st, 55% of LGBTQ consumers say that they’ve made an Amazon Purchase in the last week. In March and April, that percentage was around 36-37%.
Why could that be?
Take a look at the descending red line in the first graph. The percentage of LGBTQ consumers who say that they don’t splurge on themselves has declined dramatically this month, even though September isn’t over yet.
Along with the notes above surrounding desire for experiences and products, this likely correlates with a recent increase in consumer confidence among LGBTQ consumers, and the General Population more broadly. Preliminary data shows that LGBTQ consumers are beginning to feel more optimistic about their financial futures than they have over the past several months, but more on that in an upcoming post.
LGBTQ consumers are in the mood to buy – whether that be experiences or products. How long that trend lasts is anyone’s guess, and will most likely be tied to advancements in our economic recovery and a decline in anxiety about the pandemic. What we do know, however, is that LGBTQ consumers are incredibly loyal to their preferred products and brands. So, now is a great time for companies to focus on captivating these cherished consumers, who together make up roughly $3.7 Trillion in spending power, as they pick up the pace of spending heading into the fall travel and holiday shopping season.


